WakaChart
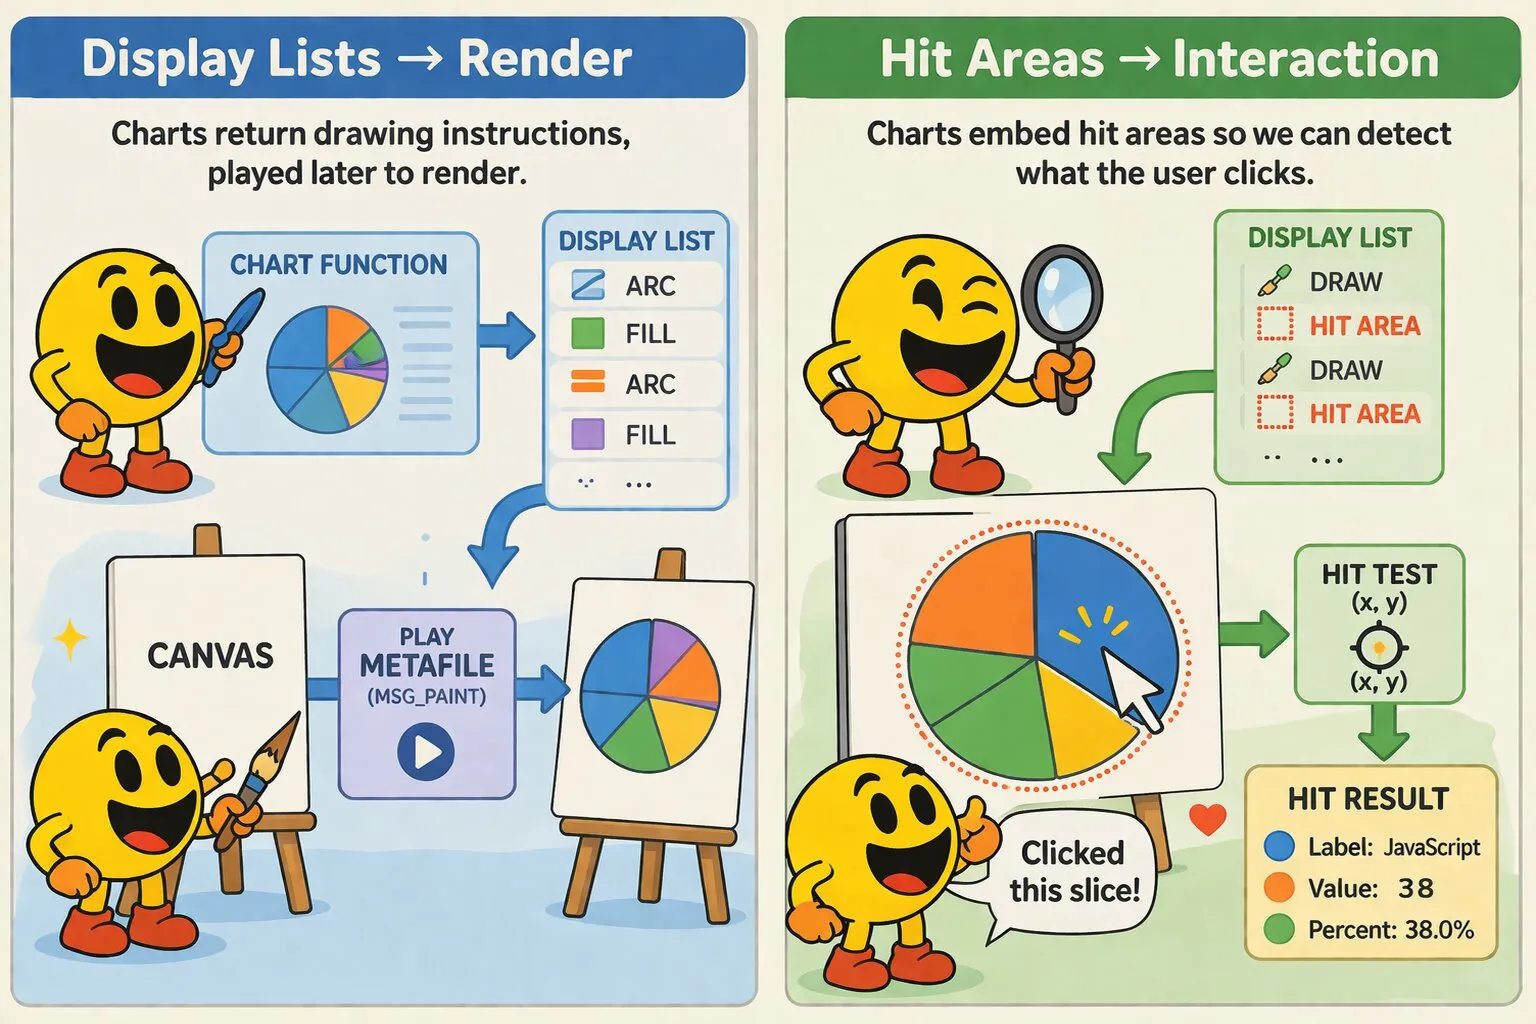
WakaChart is a chart plugin for wakaPAC. It produces display lists for rendering charts onto canvas components — charts are not drawn directly, they return a sequence of drawing instructions that wakaPAC.playMetaFile() executes during MSG_PAINT. This separates chart logic from rendering and enables hit testing, caching, and compositing.
Getting Started
Include the script after wakaPAC and register the plugin:
<script src="https://cdn.jsdelivr.net/gh/quellabs/wakapac@main/wakapac.min.js"></script>
<script src="https://cdn.jsdelivr.net/gh/quellabs/wakapac@main/plugins/wakachart.min.js"></script>

<script>
    wakaPAC.use(WakaChart); // must be called before any wakaPAC() calls
</script>
WakaChart injects a chart handle into the _chart property of every component automatically — no declaration is needed. The handle is available before init() runs:
<canvas data-pac-id="myChart" width="500" height="400"></canvas>
<div data-pac-id="hitResult"><p>{{ result }}</p></div>
const MSG_CHART_HIT = wakaPAC.MSG_USER + 0x100;
wakaPAC('myChart', {
_lastDL: null,
data: [
{ label: 'JavaScript', value: 38 },
{ label: 'PHP', value: 26 },
{ label: 'Python', value: 18 },
{ label: 'TypeScript', value: 11 },
{ label: 'Other', value: 7 }
],
msgProc(event) {
switch (event.message) {
case wakaPAC.MSG_PAINT: {
const ctx = wakaPAC.getDC(this.pacId);
const dl = this._chart.pieChart(ctx, this.data);
ctx.clearRect(0, 0, ctx.canvas.width, ctx.canvas.height);
wakaPAC.playMetaFile(ctx, dl);
wakaPAC.releaseDC(ctx);
this._lastDL = dl;
break;
}
case wakaPAC.MSG_LCLICK: {
const pos = wakaPAC.MAKEPOINTS(event.lParam);
const hit = wakaPAC.metaFileHitTest(this._lastDL, pos.x, pos.y);
wakaPAC.postMessage('hitResult', MSG_CHART_HIT, 0, 0, { hit });
break;
}
}
}
});
wakaPAC('hitResult', {
result: 'Click a slice...',
msgProc(event) {
switch (event.message) {
case MSG_CHART_HIT: {
const hit = event.detail.hit;
this.result = hit
? `${hit.label} — ${hit.value} (${hit.percent}%)`
: 'Click a slice...';
break;
}
}
}
});The chart handle is injected before init() runs, so it is available immediately. Each chart function returns a display list — wakaPAC.playMetaFile() executes it during MSG_PAINT. The display list is retained between paint and click so metaFileHitTest() has something to test against.
Usage
Data Format
All chart functions accept data in either of two formats. Both can be mixed in the same array:
// Plain numbers — label defaults to empty string
const data = [38, 26, 18, 11, 7];

// Objects with label and value
const data = [
    { label: 'JavaScript', value: 38 },
    { label: 'PHP',        value: 26 },
    { label: 'Python',     value: 18 }
];
Non-finite and negative values are silently filtered out.
Hit Testing
Chart functions embed hitArea entries in the display list alongside drawing instructions. Two functions are available:
// Returns the data payload of the first hit area under the point, or null
const hit = wakaPAC.metaFileHitTest(dl, x, y, offsetX, offsetY);

// Returns true if the point falls within any hit area
const over = wakaPAC.ptInMetaFile(dl, x, y, offsetX, offsetY);
Coordinates are in container space. Pass the same offsetX/offsetY that were passed to playMetaFile — the functions subtract them internally. All chart types return hit area data with a consistent shape:
| Property | Type | Description |
|---|---|---|
index | number | Zero-based position in the data array |
label | string | Label string, or empty string if not provided |
value | number | Data value |
percent | number | Value as a percentage of the total (one decimal place) |
Compositing Charts
Display lists can be played at an offset to composite multiple charts onto a single canvas. Each chart function works in (0, 0)-relative coordinates — positioning is the caller's responsibility:
wakaPAC.playMetaFile(ctx, dl1, 0,   0);    // top-left
wakaPAC.playMetaFile(ctx, dl2, 300, 0);    // top-right
wakaPAC.playMetaFile(ctx, dl3, 0,   200);  // bottom-left
Per-Component Options
To set per-component chart defaults or use a different property name, add a wakaChart key to the component's config. Any keys beyond property become chart option defaults, merged with global defaults and overridable per call:
wakaPAC('myChart', {
    wakaChart: {
        property:       '_chart',   // optional — defaults to '_chart'
        legendPosition: 'right',
        font:           '13px sans-serif'
    }
});
Sparklines in Foreach Lists
Sparklines are typically rendered inside foreach list items. The pattern uses a single parent component that listens for MSG_FOREACH_REBUILT and blits a sparkline onto each item's canvas element:
<div data-pac-id="productList">
    <ul data-pac-bind="foreach: products" data-pac-marker="productList">
        <li>
            {{ item.name }}
            <canvas class="spark" width="100" height="30"></canvas>
        </li>
    </ul>
</div>
wakaPAC('productList', {
products: [
{ name: 'Widget A', sales: [12, 15, 11, 18, 22, 19, 25] },
{ name: 'Widget B', sales: [30, 28, 25, 27, 24, 22, 20] },
{ name: 'Widget C', sales: [5, 6, 8, 7, 9, 11, 10] }
],
msgProc(event) {
switch (event.message) {
case wakaPAC.MSG_FOREACH_REBUILT: {
if (event.detail.marker !== 'productList') {
break;
}
const arrayName = event.detail.arrayName;
const canvases = this.container.querySelectorAll('canvas.spark');
for (let i = 0; i < canvases.length; i++) {
const offscreen = wakaPAC.createCompatibleDC(this.pacId);
const dl = this._chart.sparkline(offscreen, this[arrayName][i].sales);
wakaPAC.playMetaFile(offscreen, dl);
const destCtx = wakaPAC.getDCFromElement(canvases[i]);
destCtx.clearRect(0, 0, canvases[i].width, canvases[i].height);
wakaPAC.stretchBlt(destCtx, offscreen, 0, 0, canvases[i].width, canvases[i].height);
wakaPAC.deleteCompatibleDC(offscreen);
}
break;
}
}
}
});API
wakaPAC.use(WakaChart, options?)
Registers the WakaChart plugin with the wakaPAC runtime. Must be called before any wakaPAC() calls.
| Parameter | Type | Description |
|---|---|---|
WakaChart | object | The WakaChart plugin object |
options | object | Optional global defaults applied to all chart calls. See Global Options below. |
Returns void | ||
chart.pieChart(ctx, data, opts?)
Produces a display list for a pie chart. Slices start at 12 o'clock and proceed clockwise. Visual gaps between slices are drawn as a background-colored stroke so boundaries always meet cleanly at the centre.
| Option | Default | Description |
|---|---|---|
showLabels | true | Show percentage labels inside slices |
labelColor | '#ffffff' | Color of percentage labels inside slices |
showLegend | true | Show legend |
legendPosition | 'bottom' | Legend position: 'bottom' or 'right' |
gap | 2 | Gap between slices in pixels |
minSliceAngle | 0.15 | Minimum slice angle in radians before percentage label is omitted |
Returns array | Drawing instructions to create the chart | |
chart.barChart(ctx, data, opts?)
Produces a display list for a vertical bar chart. Each bar is colored from the palette. Y-axis tick labels are measured before layout so the chart area is correctly offset. Horizontal grid lines are drawn at each tick.
| Option | Default | Description |
|---|---|---|
tickCount | 5 | Number of Y-axis ticks |
barGap | 0.25 | Fraction of slot width used as gap between bars (0–1) |
axisColor | '#cccccc' | Color of the baseline |
gridColor | '#eeeeee' | Color of horizontal grid lines |
Returns array | Drawing instructions to create the chart | |
chart.lineChart(ctx, data, opts?)
Produces a display list for a line chart with dot markers at each data point. The first and last points sit exactly on the left and right edges of the chart area. Dots are drawn as a filled ring — outer color matches the line, inner fill matches background. Hit areas are twice the dot radius for easier interaction.
| Option | Default | Description |
|---|---|---|
lineColor | First palette color | Line and dot color |
lineWidth | 2 | Line stroke width in pixels |
pointRadius | 4 | Dot radius in pixels |
smooth | false | If true, uses cubic bezier curves between points instead of straight lines |
tickCount | 5 | Number of Y-axis ticks |
axisColor | '#cccccc' | Color of the baseline |
gridColor | '#eeeeee' | Color of horizontal grid lines |
Returns array | Drawing instructions to create the chart | |
chart.sparkline(ctx, data, opts?)
Produces a display list for a minimal inline line chart with no axes, labels, or legend. Y-axis scales from the data minimum to maximum, making variation more visible at any value range. No hit areas are emitted.
| Option | Default | Description |
|---|---|---|
lineColor | First palette color | Line color |
lineWidth | 2 | Line stroke width in pixels |
smooth | false | If true, uses cubic Bézier curves between points |
showEndPoint | true | Show a dot at the last data point |
pointRadius | 3 | End point dot radius in pixels |
Returns array | Drawing instructions to create the chart | |
Global Options
These options can be set at registration time via wakaPAC.use(WakaChart, options) and apply to all chart calls. Per-component config and per-call options take precedence:
| Option | Default | Description |
|---|---|---|
colors | Built-in palette | Array of color strings cycled across data points |
font | '12px sans-serif' | Font for axis labels, value labels, and legend text |
padding | 16 | Inner margin from canvas edge in pixels |
background | '#ffffff' | Background color — used for gap strokes between pie slices and dot centres on line charts |
legendColor | '#333333' | Color for legend labels and axis text |
legendFont | '12px sans-serif' | Font for legend labels |
Notes
Chart functions receive the canvas context for text measurement and canvas dimension reading only — no drawing occurs during the function call. The context must be a valid CanvasRenderingContext2D with its canvas property set correctly.
Display lists must be retained between MSG_PAINT and MSG_LCLICK for hit testing to work. Store the last display list on this after calling playMetaFile().
Sparklines emit no hit areas. metaFileHitTest() always returns null for a sparkline display list.
The background option must match the actual canvas background color for pie slice gaps and line chart dot centres to render correctly. The default is #ffffff — update it if your canvas has a different background.
Best Practices
- Register before creating components — call
wakaPAC.use(WakaChart)before anywakaPAC()calls so the_charthandle is injected correctly during component creation. - Produce display lists outside MSG_PAINT when possible — build the list in
init(), data callbacks, or event handlers and store it onthis. The MSG_PAINT handler should only callplayMetaFile()on pre-built lists. - Always retain the display list after painting —
metaFileHitTest()operates on the last rendered list. Assign it tothis._lastDLafter everyplayMetaFile()call. - Match background to canvas color — set the
backgroundoption to match your canvas background so pie gaps and dot centres render correctly. - Use data-pac-marker with multiple foreach bindings — add
data-pac-markerto each foreach element and checkevent.detail.markerinMSG_FOREACH_REBUILTto route to the correct drawing logic.